AUC (area under the curve) considered harmful
January 15, 2020, 6:58 pmThe title is stolen from Dijkstra.
Papers submitted to medical journals below the top rank are most often reviewed by medical reviewers who have used the Wilcoxon test as a catch-all in their active days. To smuggle a paper though their phalanx, garnish it generously with:
- p-values
- Wilcoxon-tests (t-test: “The authors should test for normality”)
- p-values
- Bland-Altman plots
- p-values
- Area under curve (AUC)
- p-values
Other modernistic stuff will delay the review process: “The authors should supplement their Bayesian analysis by non-random methods that provide correct p-values”. There is nothing wrong with Wilcoxon tests and Bland-Altman plots, and the mentioned AUC is on the boundary to semi-professionalism, so is is worth a look. Anything left I did not mention?
End of soapbox, let’s get serious
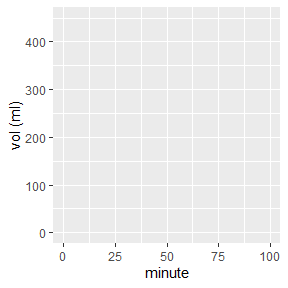
The AUC (area under the curve) or the AOB (signed area over baseline) is popular because it is easy to calculate: for the case of equidistant points, it is the average over all values multiplied with the record duration. Or, equivalently, the area of a the equivalent rectangle shown as shaded area below, which has a height equal to the mean volume and a width equal to record duration. There are better approximation for the AUC (Gabrielsson (2006), p. 161), but that does not change the validity of the arguments in the following.
- The average over all data points recorded is moderately informative. Assuming the vertical axis shows a volume, it has units of ml, which is easy to understand, but the dependency on the arbitrary record duration is awkward. Should the study result depend on the time the patient or experimenter is willing to sit around and wait?
- The record duration is mostly arbitrary. It may differ between records, e.g. when we have to stop recording before target time.
The AUC is highly biased when used naively; that is, when it is computed over an arbitrary record duration.
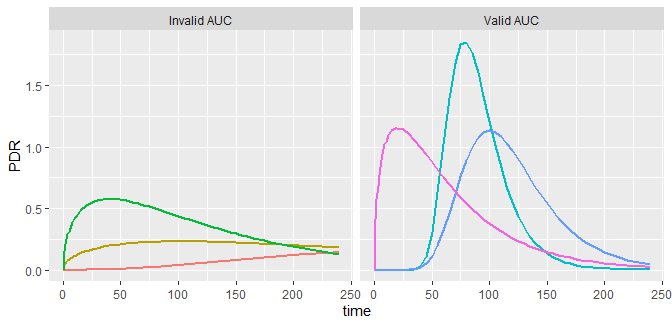
The AUC is very useful when computed up to very large times, when the volume has gone back to baseline and no further contribution to the area is to be expected. This is illustrated in the curves below, which are similar to the PDR curves recorded in 13C breath tests. For all time series shown, the total area under the curve up to infinity has been chosen to be the same. The AUC is a measure of bioavailability (Gabrielsson 2006), the chief reason why in non-compartmental pharmacodynamics it is the prime parameter of interest. The AUCs computed from the recorded data range is invalid in the left panel, but a good approximation in the right panel.
Record too short? Nothing lost!
It is possible to compute the AUC up to infinity even when only a limited data set is available; or, even worse, when the duration of the records is not the same between test units. First, you have to fit a model curve to your data that goes back to the reference line at infinity, and has a finite improper integral; the first does not imply the latter. Remember high school calculus: the function 1/x does not have an improper integral - it is infinite - but 1/x2 has one; even 1/x1.0001 has one.
In analysis of 13C breath test curves (see Bluck (2009) for a review), the Gamma function from earlier publications does not have an improper integral, while the exponential beta function has one; some examples are given here. In analysis of gastric emptying, the power exponential generally does not have an improper integral, but the linexp function has one, so the AUC can be calculated.
Once you fitted a parametric curve to your data, the (the only, real, valid, nice!) AUC can be computed by consulting an integral table or feeding Wolfram Alpha. Note that a spline function cannot be used in this case, because the spline is a spline is a spline and thus flexible to bend to data’s capriciousness, but it does not know where volume will wander in the infinite future.
Too much to remember for the next meeting with you boss (the “we did all with Wilcox” guy)? Read the executive summary:
When you present a time series curve …
- … and someone suggests “compute the AUC”, follow Nancy Reagan and just say no. It is almost always the wrong approach, even if the tests give wonderful p-values.
- … if the someone insists, ask whether using the average over all measured points instead will do1. A ‘yes’ answer is acceptable, a ‘no’ means that someone misuses poor AUC for pseudo-scientific blow-off.
- … if you have measured the curve long enough until it is back to baseline, say “Sorry, will try”. With the exception of some gastric emptying studies, I have never encountered such a case, because patient and experimenters share the desire to be home in time.
- … if you have fitted a parametric curve, you can often compute the AUC. It might be useful to quantify your study data, but always consider other alternatives, such as peak height or peak position which you also can extract from the fit. And don’t try half a dozen parameters extracted from a fitted curve to pick “the significant one”; I wish more people would disappear into Nirwana when hiking the garden of forking paths of Borges and Gelman.
1: Use a weighted mean for non-equidistant points
Robustness can hurt
One feature of AUC is its robustness; the form of the curve does not play a role, a curve with two peaks can have the same AUC as one dropping down montonously, even if both curves tell different stories. Robustness can be a virtue, but can also hide interesting effects; or, to tell your boss: you may loose power by reducing curve details to an area.
When you find a good model function for your interesting alternatives, you are back in power.